CloudWatch is the AWS service for gathering data about the resources you’re using. It includes logs and graphs to help you analyze data such as processor and network usage. It’s such a vital part of your AWS workload that it’s worth exploring in further detail.
In CloudWatch, each type of data is called a metric. Out of the proverbial box, AWS provides metrics such as CPU utilization for EC2 servers or item latency for DynamoDB operations. You can use this data, for example, to detect problems and gather general statistics. You can look for servers that have higher-than-normal utilization or too-high inbound network activity (which would be indicative of an attack).
You can also create your own custom metrics that your applications can send to CloudWatch, such as page view counts per minute or second, or number of logins each minute. Your entire infrastructure can then provide a constant flow of individual data points. By default, your metrics are tracked per minute; however, you can optionally create “high resolution” metrics that are tracked per second.
Individual data points each get a name based on the metric, along with a numerical value or array of numerical values. You can add a timestamp, or AWS will add one automatically. You can also provide dimensions (which are like categories) to each metric to help you organize and search through your collection of metrics.
For example, you might have a metric called PageViews, and you would send such a data point to CloudWatch every minute showing how many web pages were rendered that minute. You would store the count in the data point’s value field.
But what if you have multiple web applications and need to know which one a specific data point adheres to? You could store the name of the app as a dimension. The dimension’s own name might be AppName with a value (for instance) of ProductSearchApp. You might have other dimensions based on your statistical needs, such as RequestMethod or PageName. In CloudWatch, you could search then for all metrics where WebApp is ProductSearchApp, and refine your search by adding in specific page name dimensions.
Let’s use node.js and the AWS node.js SDK to create some custom metrics. To use this code, you’ll need to install the aws-sdk package:
npm install --save aws-sdkThen you can run the following code, which sends up a single data point for a metric called PageViews:
var AWS = require("aws-sdk");
AWS.config.update({ region: 'us-west-2' });
var cw = new AWS.CloudWatch({ apiVersion: '2010-08-01' });

var datapoint = {
    MetricData: [
        {
            MetricName: 'PageViews',
            Dimensions: [
                {
                    Name: 'AppName',
                    Value: 'ProductSearchApp'
                },
                {
                    Name: 'PageName',
                    Value: 'ClothingCategory'
                }
            ],
            Unit: 'None',
            Value: 30
        },
    ],
    Namespace: 'Traffic'
};

cw.putMetricData(datapoint, function(err, data) {
    if (err) {
        console.log(err);
    }
    else {
        console.log(data);
    }
})
The metric has a single value denoting the number of page views since the previous data point, along with two dimensions, AppName and PageName. We also include a namespace, which is essentially another category and is required. Notice that we’re creating a data point without telling CloudWatch in advance about the metric’s name (PageViews) or dimensions (AppName and PageName). CloudWatch gleans all this from the data point itself and begins to track statistics for these names and dimensions, grouping future data points with them.
You can run this code repeatedly, each time changing the values for the two dimensions along with the value for the data point’s own numerical value. (You’ll want to wait a minute or so in-between runs. If you wait before a minute, CloudWatch will average out the values for data points within a minute.)
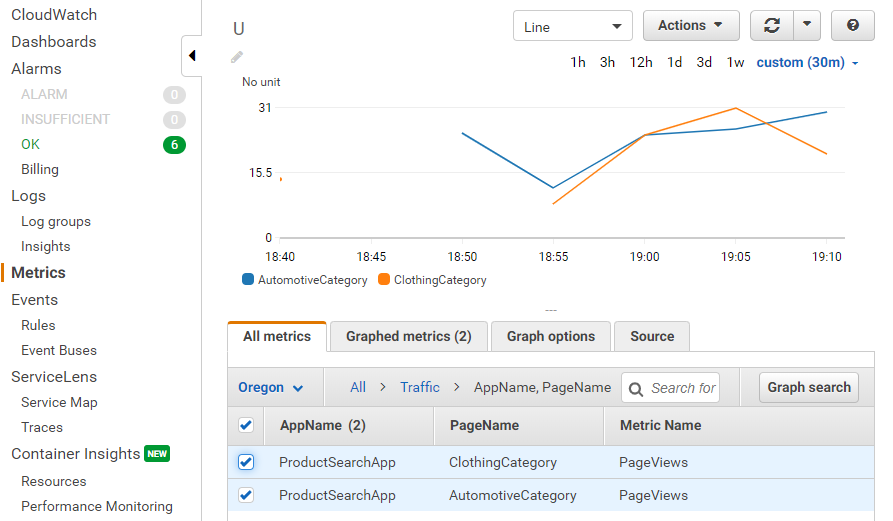
After a while, you can start to see the data in the CloudWatch control panel; click on the metrics link on the left side of the screen. You’ll see the different app names and page names you created. Check the box by each to show it in the graph. Below is an example screenshot; notice the different dimensions displayed:
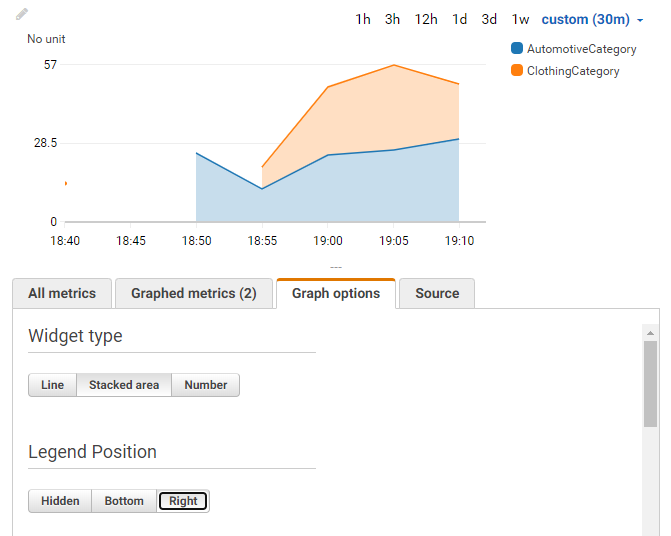
You can also provide different options for the graph; here’s a slightly different example with the graph type changed:
Conclusion
CloudWatch provides much more than what we’re demonstrating here, but this will get you started in sending custom metrics up to CloudWatch. You can also use other languages and SDKs, such as Python or even bash scripts.