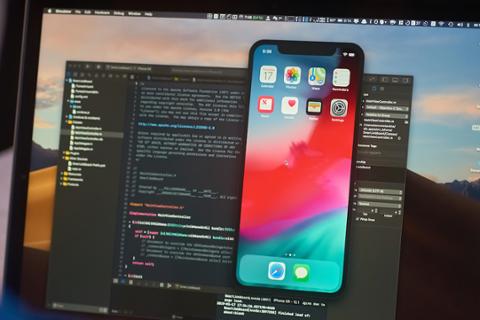
Apple’s Xcode IDE (integrated development environment) is an incredibly robust tool that most iOS developers use daily. It’s also really complex. Already packed with tons of tooling, each iteration of Xcode brings new platforms, tips, tricks, and shortcuts to remember.
Naturally, a lot gets lost in the shuffle. It’s impossible to remember every single keyboard shortcut or setting for Xcode, but we’ve got a few that may save you time, improve your coding experience, and just plain eliminate frustration.
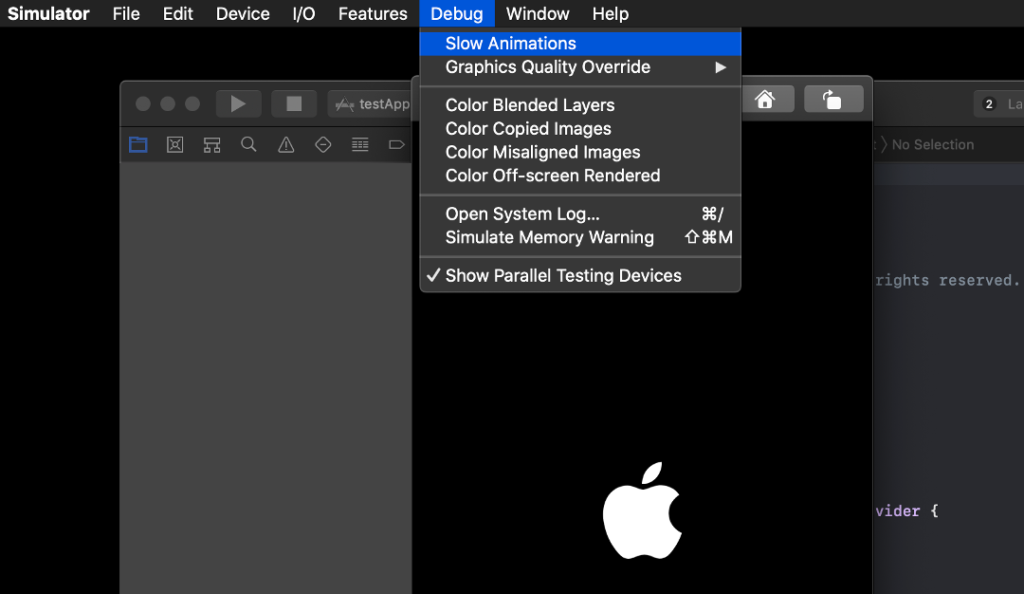
Make Animations Crawl
If you use animations in your app for loading screen views or in-app sharing options, chances are good that you’ve created (or pinched from GitHub, no judgement here) a snappy animation in some other program. And sometimes what looks great in another app doesn’t look great in Xcode’s simulator, which is indicative that it’s not going to look right in your app. (Or your animations may look great in a simulated environment, but you want to make sure every frame is perfect. Users appreciate that!)
A great option is to slow your animations down so you can discover where they may be glitching or stuttering. In Xcode, simply run your app to bring it up in the simulator. Then select “Debug” in the simulator menu bar and choose “Slow Animations.” It may require a restart, but now your in-app animations will be slowed dramatically so you can identify issues.
Act Like a Web Dev
No, no, we’re not advocating you use JavaScript; rather, use view frame debugging to make sure your on-screen text and imagery are perfectly aligned.
When web developers debug, they often use a browser plugin such as Pesticide to see text boxes and hidden frames. It helps ensure things are aligned properly and will render as desired on any screen.
Xcode can do this, too. We really like this tip because it helps identify touch targets in your app, and see where users may have conflicting touch vectors in an app. Simply start your app, visit the “Debug” menu in the menu bar, choose “View Debugging,” and toggle “Show View Frames” on. Now your app will make all the web devs jealous!
A 3D View for – Well, Views!
If you’re a visual learner, picking through your codebase is tedious work that you really don’t like. We get it! Instead, try viewing your views in 3D to debug your, um, views.
Larger apps with several view controllers can prove difficult to debug. Say a view doesn’t appear when you feel it should (we’ve all been there) and reading through your view hierarchy in Xcode doesn’t surface any answers. Let’s be honest: Most of the time, the solution is simple, and not worth the time spent reading through lines of code.
You can view your app’s views in 3D in Xcode’s main window, which we think may help you identify issues with views faster. After running your app, get into the Debug menu, select “View Debuging,” then “Capture View Hierarchy.” Once your hierarchy has loaded, you can grab and drag your view around in Xcode, and it will show all of your views in 3D. Amazing!

Renaming Everything
This is a trick that pops up every now and then in iOS developer circles, and we’re surprised more people don’t take advantage of this Xcode feature. It’s simple and allows you to rename classes or variables throughout your codebase quickly and easily.
Hold down the Command key while clicking the class or variable you want to rename in the Navigator view on the left side of the Xcode window, then select “Rename” from the popup menu. This renames the item everywhere it’s used in your codebase; no more chasing each mention down to squash bugs!
Run Multiple Tests
You’ve likely created several tests for your app in Xcode, then iterated on your code… and forgot exactly which test you should run to debug your latest commits. Awkward.
Instead of guessing and running individual tests, run multiple tests in Xcode. In the Navigator view on the left side of your Xcode window, hold down the Command key while selecting the tests you’d like to run. Once you’ve selected all the tests you’d like to run, right-click on any test and choose “Run (x) Tests” from the resulting pop-up window. Now your tests will run concurrently.