At work, I'm part of a team that maintains a software product in the
proptech sector. It’s popular (i.e. it sells well, generates revenue, and dominates its particular sub-market), and as a result, we’ve had to keep the code going far beyond its “natural lifespan.” Moreover, it was created 30 years ago, with 20 major releases, and enjoys a huge legacy customer base. While it’s fun to work on something so popular, software that old presents some challenges. First, it has acquired
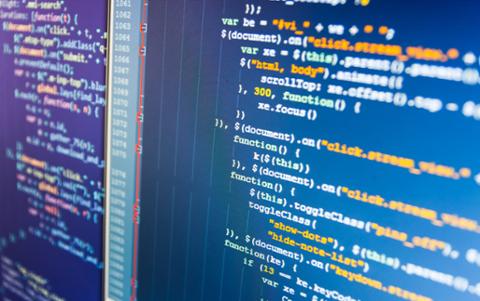
significant technical debt, as well as “architectural debt”: Its 16-bit structures hinder its growth in an increasingly 64-bit world. The computation engine at the heart of it, which uses 16-bit addressing, occasionally overflows, and changing over to 32-bit isn’t an easy thing to do (to put it mildly). Our platform is also a hybrid of four different programming languages: Delphi with a WinForms interface, a homebrew Pascal compiler, a non-relational database processing and reporting language, and, more recently, C# with WPF hosted in WinForms. (There's also an older report writer language, but much of that has been converted into C#.) Sound confusing? Oh, it is! The C#/WPF was a major addition to modernize the old WinForms interface, and is now a hybrid of WinForms and WPF (yes, you can
combine the two different technologies in the same .exe). Our 1.3 million lines of Delphi include two different compilers, plus a 16-bit computation engine and lots more. The engine runs compiled code output by both compilers: the homebrew Pascal and the non-relational database language. This handles all business and financial calculations involved in managing properties and tenants, as well as tricky elements such as regulatory compliance.
Improving the Code
One day, our management decided that the code needed to be faster and more bug-resilient, and that testing (much of which had previously been done manually) should be automated as much as possible. Adding tests is a 'Painting the Forth Bridge' type of job that's never completed. (For those unaware, that's a colloquial expression for a never-ending task; according to legend, painting the huge
Forth Bridge takes so long that once the task is completed, it’s time to start repainting.) Adding tests is usually something best done with new code, not retrofitting old code, but we had our marching orders. That being said, we saw the value in the task: manual tests could take months, and we could devote the time saved by automation to other, vital tasks (such as working down technical debt). Adding tests to the code written in the homebrew Pascal and database processing languages wasn't deemed too vital. Tests in the Delphi code for the compilers would be enough, so long as the tested code called the underlying routines.
Dunit
For unit testing and Delphi,
Dunit is the way to go. It's part of a family that started with sunit (for Smalltalk) and includes Junit for Java and Nunit for .NET applications. In newer versions of Delphi (XE8 and higher), Dunit has now been deprecated; you should use
DUnitX instead. (Unfortunately, my team is still on the XE7 version of Delphi and stuck with Dunit.) If you're familiar with ?Unit testing, the principle of tests is akin to instantiating an OOP class. First, you perform SetUp, constructor-like initialising common data, then perform the tests (calling each of the test methods), followed by a TearDown/destructor to tidy up afterwards (
more details here). We had to decide which tests to build in. I started with financial calculations (e.g., accruing in a loop, currency conversions, through to transactions, and so on). As these change the state of a database, a special database just for testing had to be created.
Profiling
Testing just tells you that your code is running correctly, but it normally doesn't tell you which bits are taking the longest. Profiling helps with that. I found an open source profiler for Delphi,
GpProf, including three source files that are added to your Delphi project when it is compiled. GpProf works by reading in your entire project’s sources and letting you select the units, classes and procedures that you wish to profile. It then adds entry and exit calls to methods in the selected procedures; after that, you recompile it. As it runs, it collects accurate timings about how long things take. It works surprisingly well, and the GUI application gives you insights into the codebase, but with 1.3 million lines that's a lot of code to profile. Too much, in fact, to do it one go—so I had to narrow it down to a much smaller subset and work on that. If you follow this procedure, make sure that your source code is backed up, because it modifies any file you select with those function calls. You can remove them afterwards with a single command, but just in case that fails, keep a backup copy.
Conclusion
Adding tests is a slow process, but it has helped remove some long manual tests. Profiling, however, has proven less effective than I’ve hoped. Having profiled less than 20 percent of the codebase at this point, I can only hope of more speed gains to come.