This is the first tutorial in a series on learning to program in Dart, Google's alternative to JavaScript. Although no other browser manufacturer has shown any interest in implementing Dart, JavaScript has certain flaws, particularly in maintaining large applications that effectively limit it. Big JavaScript applications are hard to debug and maintain. Google developed its Web Toolkit, or GWT, for developing applications in Java, then translating them to JavaScript. Dart takes a similar approach. You write and test your code in Dart, then output JavaScript that runs in the browser. It's not intended to replace JavaScript, but to provide an alternative path. In this tutorial, I'll explain how to get set up with Dart's tool chain (the tools needed to develop Dart applications). In the next post, we'll start writing Dart code. Though Dart can be used to develop the client side of any Web application, my angle is slanted toward game development.
Getting Started
Dart's tools are cross-platform on Windows, Mac and Linux, which covers most developers. They're based on Eclipse, the open source Java IDE and platform, and you can have either 32-bit or 64-bit versions. Eclipse is a solid and reliable technology, well known to Java developers, and the Dart team's integrated the Dart-to-JavaScript translator and software development kit to work with it. Compared to standard Eclipse, the menu options have been trimmed down, which works very well. Where Raw Eclipse can be overwhelming, the Dart Editor looks very nice. It comes with seven sample applications that you can select and run. When you do, you'll see project files on the left-hand side. Click on any of them to view the source code files in the editor window. Since Dart is for browsers, each project comes with an HTML file and CSS as well as its Dart code file. The simplest way to run the program is to click [Control] R. In each example, the files appear on the left-hand side and cause some clutter. Right-click on any project folder and click-delete to remove them from the workspace. However, be sure not to check "Delete project contents on disk" unless you really mean to. There's no need to remove the Dart SDK, as it's a reference to the source code files that make form it.
Run Solar
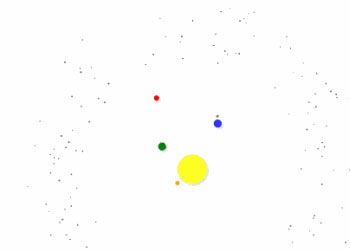
Once you've got the IDE setup, click "Solar" on the Welcome tab. That will open the example called -- you guessed it -- Solar. Then take a look at solar.dart, which should be open in its own tab.

Don't start with Solar3D as it uses WebGL and is quite complex. When you run Solar, it opens up Chrome (which is recommended, so install it) and runs in its own Web server at 127.0.0.1:3030/path to files. Or enter http://127.0.0.1:3030 to find available Dart Web applications to run.
Debugging
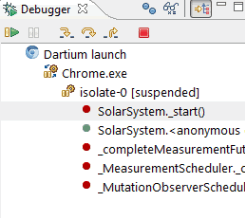
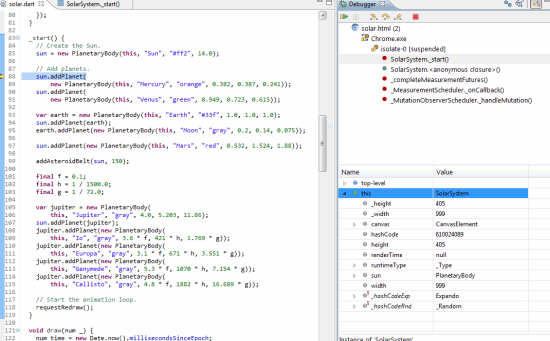
Coming from a world where I could step through my code line by line, when I first encountered JavaScript 10 years ago, one of the things I really disliked was what happened when my code didn't work. Without debugging, you were limited to using lots of prints and alerts. When tools like Web Developer and Firebug came along, they greatly improved life for novice JavaScript developers. Dart code can be debugged and stepped through line by line. First click "Tools" on the menu, then "Debugger." This opens a tab showing the debugger controls as well as stack trace, which shows which functions called which to get to the point where the program is once it hits a break point. To get a feel for it, try this: With the Solar project open, scroll down to line 85, which should look like this: sun = new PlanetaryBody(this, "Sun", "#ff2", 14.0); Right click on the very left of the line (the gutter), several spaces to the left of "sun = ". You should see a menu with choices that include "Toggle Breakpoint" and "Show Line Numbers." I like to have line numbers on, so I suggest you enable them. When you click "Toggle Breakpoint," you should see a blue circle in the gutter. This indicates a break point. Now run the solar application, and it should stop executing at that line. If you look at the top row of the debugger tab you should see a green triangle followed by three arrows and a red square. There are five controls:
- Green Triangle runs the program from here (or press F8)
- The first arrow, "Step Into," runs one line of code, stepping into functions, etc. (or F5).
- The second arrow, "Step Over," runs lines of code, such as functions. (or F6).
- The third arrow, "Step Return," runs up to and including the return. (or F7).
- The Red Square stops the debugging and returns you to editing (or press [Control] F2).
Heavy and Deep
Because Dart's SDK has the Dart source files, you'll often find that debugging takes you down into some heavy code. The easiest way to extricate yourself is to go back to the program and put a breakpoint further on. Then press F8 or click the green triangle. It'll take you out of the heavy stuff and back to the top level source code.
Viewing Properties
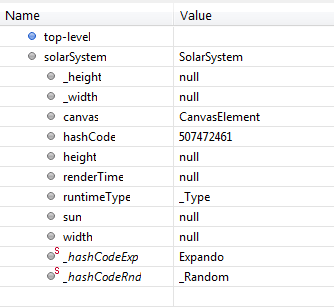
Below the Debugger stack trace is a property viewer. This lets you look quickly at variables and members of objects. Run the program up to a breakpoint on line 88 (the first Sun.AddPlanet). On the right hand side, you'll see two properties, "top-level" and "this," with green circles by them. Move the mouse over "this" and you'll see an arrow that, when clicked, drops a list of 11 more property rows including one called "sun." Move the mouse over "sun" and another drop-down arrow appears. Clicking it shows a list of the sun's properties as name/value pairs including "ff2 for color, "Sun" for name, etc.
Conclusion
This first tutorial got you used to the Dart tool chain and showed you how to run and debug existing programs. In the next one we'll look at declaring variables and creating a very simple Dart application.